Förderjahr 2020 / Project Call #15 / ProjektID: 5158 / Projekt: Web of AI
Author: Kathrin Blagec, M.D.
Benchmarking is an important pillar in AI research because it enables a quick and standardised way of assessing the performance of new model architectures and comparing different models. AI benchmarks can be seen as consisting of a task, e.g. image classification, a dataset representative for the task, e.g., ImageNet, and one or more metrics to compare and measure model performance, e.g., accuracy.
While benchmarking can be a helpful asset, its usefulness for driving and assessing progress in AI also depends on the quality and validity of the benchmark datasets and the suitability of the metrics used to assess performance.
For instance, a benchmark dataset may include too few examples of a specific class. Together with an unsuitable choice of performance metrics, this may disguise a model’s real capacities by yielding a very high performance metric score even though the model is not able to properly distinguish between classes.
This can be exemplified by the following scenario: Imagine a dataset consisting of 100 images where 95 images belong to the class ‘apple’ and 5 images belong to the class ‘banana’. Since accuracy is calculated by simply dividing the number of correct predictions by the overall number of samples, a model that predicts class ‘apple’ all the time leads to an accuracy of 95% even though the model might not at all be able to distinguish between ‘apple’ and ‘banana’. This is problematic, especially if no other suitable metrics are reported.
Knowing which metrics are currently used and what their advantages and disadvantages are helps to better understand the current state of AI capabilities. Therefore, in our first analysis based on the Intelligence Task Ontology (ITO) developed as part of the ‘Web of AI’-Netidee project, we focused on yielding a global overview of the performance metrics currently used to compare and measure the performance of AI models.
To yield such a comprehensive view, we drew from the largest open resource of Machine learning papers, Papers with Code (PWC), capturing more than 30000 benchmark results across more than 2000 benchmark datasets. Using ITO, we conducted extensive manual curation, normalised all metrics names and mapped them to metric families. This was necessary because due to the crowd-sourced annotation of performance results in PWC and a lack of standardisation of reporting metrics in the literature, one and the same metric could appear under many different naming variations. Using this approach, we were able to reduce the original list of 812 metrics to 187 distinct metrics (see Figure 1).
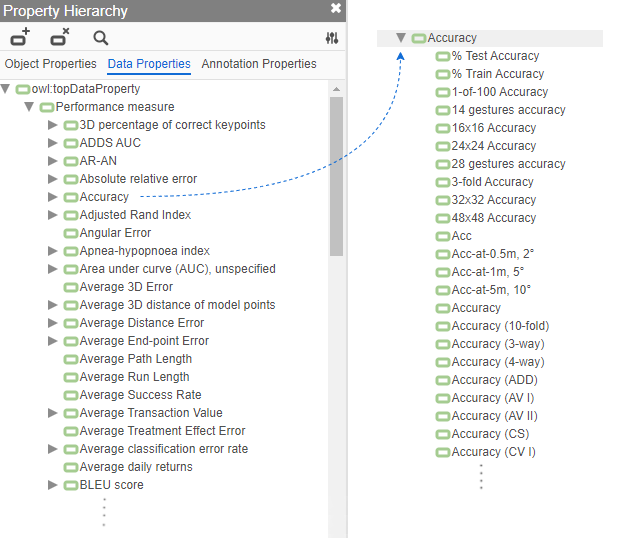
Figure 1: Performance metrics hierarchy after manual curation of the raw list of metrics. The left side of the image shows an excerpt of the list of top-level performance metrics; the right side shows an excerpt of the list of submetrics for the top-level metric ‘accuracy’.
We further classified metrics into categories based on the tasks they are usually applied to: Classification metrics, computer vision metrics, natural language processing metrics and regression metrics.
Now that we had cleaned-up data, we were finally able to create insights on questions such as:
- Which performance metrics are currently used to measure progress in AI within and across the different task categories?
- In how many cases are metrics reported alone vs. together with other metrics?
- Which metrics are frequently reported together?
- Which metrics are not or rarely used in evaluating model performance although they may be advantageous in some cases?
Here are some of the most important insights we gained from our analysis:
- Despite its widely acknowledged downsides, accuracy remains by far the most often reported classification metric: More than 38% of the benchmark datasets covered by our analysis were using accuracy as a performance metric. The second and third most commonly reported metrics were the F-measure (e.g., F1 score) and Precision, being used by 16% and 13% benchmark datasets, respectively.
- For more than two thirds (77.2%) of the analyzed benchmark datasets, only a single performance metric was reported. Further, in more than 83% of the benchmark datasets where the metric accuracy was reported, no other metrics were reported.
- Classification metrics that can be advantageous because they calculate a score based on every possible decision threshold, such as the ROC-AUC, rarely appeared in our dataset. Likewise, metrics that yield more reliable scores for imbalance datasets, such as ‘Balanced accuracy’ were not or rarely reported.
If this has captured your interest, you can find more details and results in our preprint on arXiv: https://arxiv.org/ftp/arxiv/papers/2008/2008.02577.pdf