Förderjahr 2020 / Project Call #15 / ProjektID: 5158 / Projekt: Web of AI
by Simon Ott, MSc
Based on the data calculated for the “AI benchmark life cycle map” in the previous blog post we explored further possibilities of visualizing complex AI benchmark data in a compressed and easily understood way.
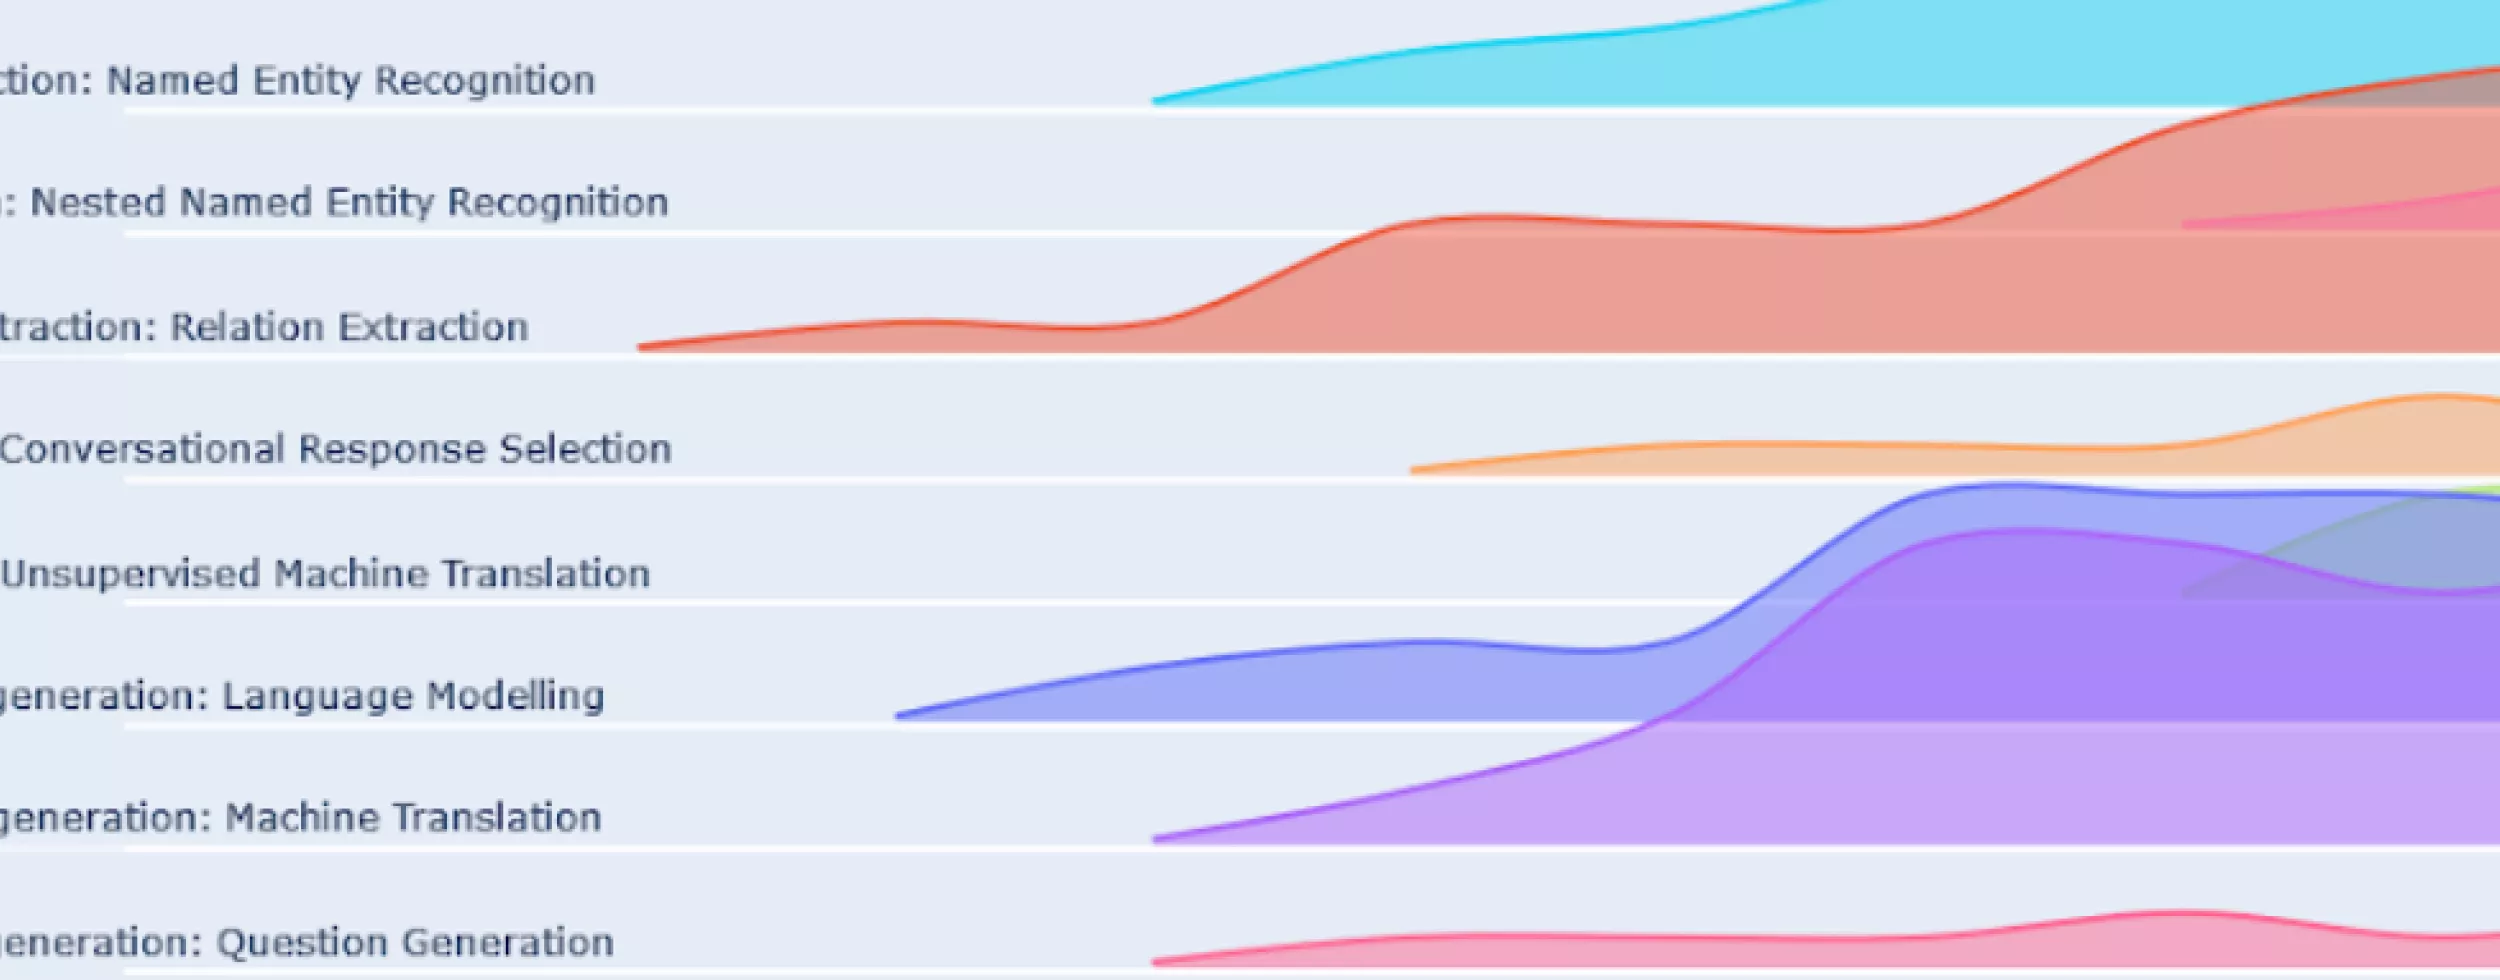
The first thing we wanted to do was plot the number of active benchmarks every year by task. The number of active benchmarks is calculated as the cumulative sum of the number of new benchmarks shifted by a year subtracted by the number of disbanded benchmarks. New benchmarks have to be shifted by a year, since a benchmark can only fall into one class every year and thus a benchmark becomes active (state-of-the-art results CAN be reported) the year after it was introduced. Below you can see the resulting chart, which plots the number of active benchmarks per year and task. As can be seen, the number of active benchmarks varies greatly between tasks and over time. Benchmarks for Named Entity Recognition, Relation Extraction, and Language Modeling have been introduced very early and have shown continuous growth. Sentiment Analysis has shown a similar trajectory, but the task saw a decline in the number of active benchmarks in recent years. For Entity Disambiguation and Semantic Textual Similarity, only a few active benchmarks were introduced very early, but their numbers have grown significantly since then.
We also wanted to see the proportion of active benchmarks reporting state-of-the-art results aggregated to top-level classes. For this purpose, we plotted the aggregated SOTA traces versus the aggregated active traces calculated above. The charts below show the number of active benchmarks reporting state-of-the-art results for the top-level classes "Natural language processing" and "Vision process" (aka Computer vision). Over the last decade, the number of active benchmarks grew greatly in both classes. Although the growth of "Natural language processing" is not slowing down, the growth rate of "Vision process" benchmarks has seemingly slowed down in 2020 compared to previous years.
In both classes, the number of benchmarks reporting SOTA results in 2020 decreased or stagnated. It should be noted that although it may suggest progress in both classes decreased in 2020, this could also be explained by missing data from the recent past.
Interactive versions of these charts can be found at https://openbiolink.github.io/ITOExplorer/.

