Förderjahr 2022 / Projekt Call #17 / ProjektID: 6252 / Projekt: CrOSSD
How can we determine the influence of companies in open source software development, and which metrics provide information about the ecosystem of an open source project?
In this blog post we want to give you some insights into the Bachelor thesis of our team member Matthias Kopeinig. The primary goal of his work is to focus on quantifying the contributions of companies to the open source software ecosystem and to develop analytical methods and metrics to identify companies’ impact in open source projects.
Research goal
In the context of this work, the question "how the influence of companies in open source software development can be determined and which metrics provide information about the ecosystem of an open source project?" is explored. To answer this research question, the following aspects are researched:
- Which metrics can serve as indicators of the influence of companies in open source software development, and how can the necessary data for calculating the corresponding metrics be collected and prepared?
- How can the nature of a company or organisation whose employees are active within an open source network be categorised?
- How can the distribution of workload be represented using a selection of representative open source projects from GitHub?
- How can repository meta-information be enriched with data from an additional data source such as WikiData's graph database?
Metrics
When researching suitable and quantifiable metrics, the fundamental question is which criteria are best suited to show company influences and to what extent these can be covered using the available characteristics and data. In this context, the majority of the metrics used were obtained from the Chaoss community, as this project provides a well-suited basis for evaluating open source projects from different areas and perspectives.
In the following, we give a description of the most important metrics covered in the analysis:
- Bus factor: The bus factor metric is a method for assessing the dependency of a software project on individual developers or groups of developers. The bus factor metric aims to quantify the risk of such dependency by identifying the number of team members who have the knowledge or skills to continue work within a project.
- Organisational diversity: Organisational diversity is a metric that looks at proportion of participating companies or organisations within a repository. Organisational diversity can contribute significantly to the health of an open source ecosystem and can be linked to many benefits.
- Organisational Influence: Organisational Influence is defined as a quantitative metric that describes the level of participation of employees of a company or organisation. In concrete terms, this means that the share of contributions from users who are subordinate to a specific company or organisation is determined.
Experiments and Findings
To obtain a sample of GitHub repositories, a list of the 10 most popular programming languages, measured by the number of repositories, was compiled. This ensures that the analysis is applied to different technologies. A total of 100 repositories were selected as sample, with 10 repositories with the highest star count of each of the 10 languages with the highest number of repositories. In total, the sample comprises 175k commits with 12k contributors.
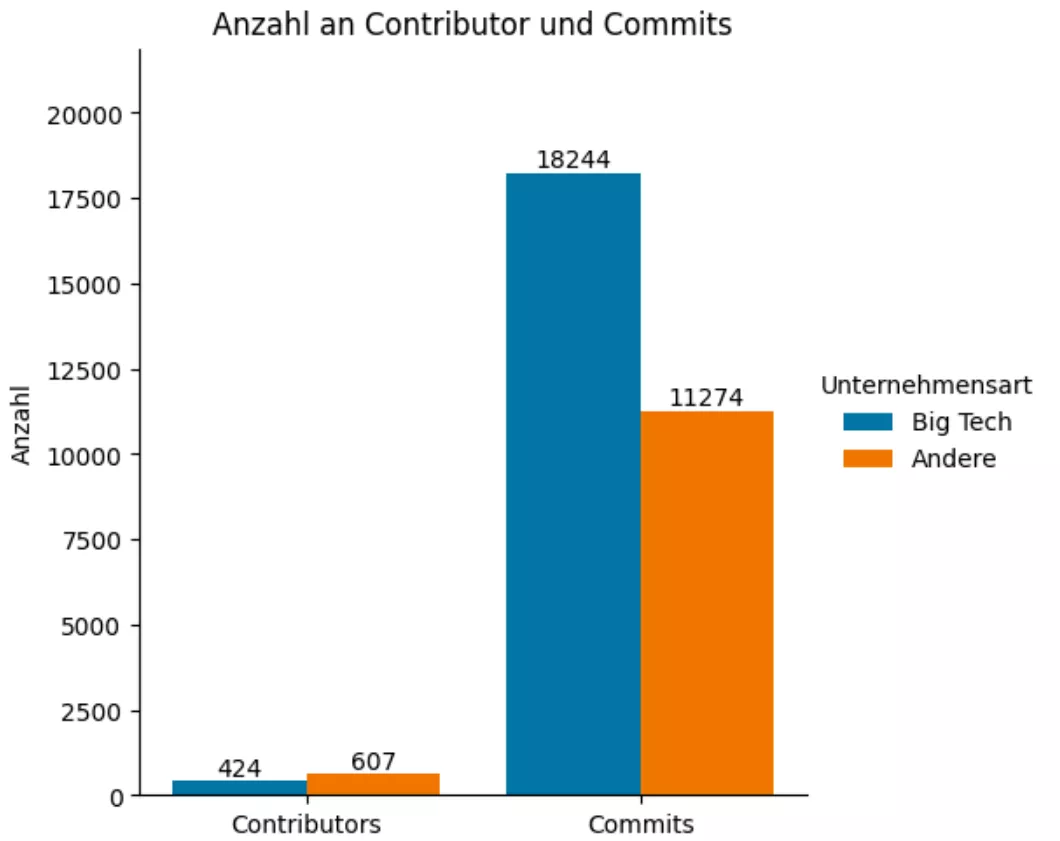
The following figure presents a bar chart grouping the contributions of big tech companies compared to other companies in open source projects. Commits from unidentifiable companies were not included.

Of all the contributors identified, those from big tech companies account for 41.1%, while the remaining 58.9% are from various other companies. The proportion of commits made by big tech companies accounts for 61.8% of all commits, while various other companies are responsible for 38.2% of commits. The two charts show interesting differences in the level of contribution by employees of tech companies. Although there are fewer contributors from big tech companies in the sample, their number of commits predominates, suggesting a more intensive contribution by people from the big tech environment.

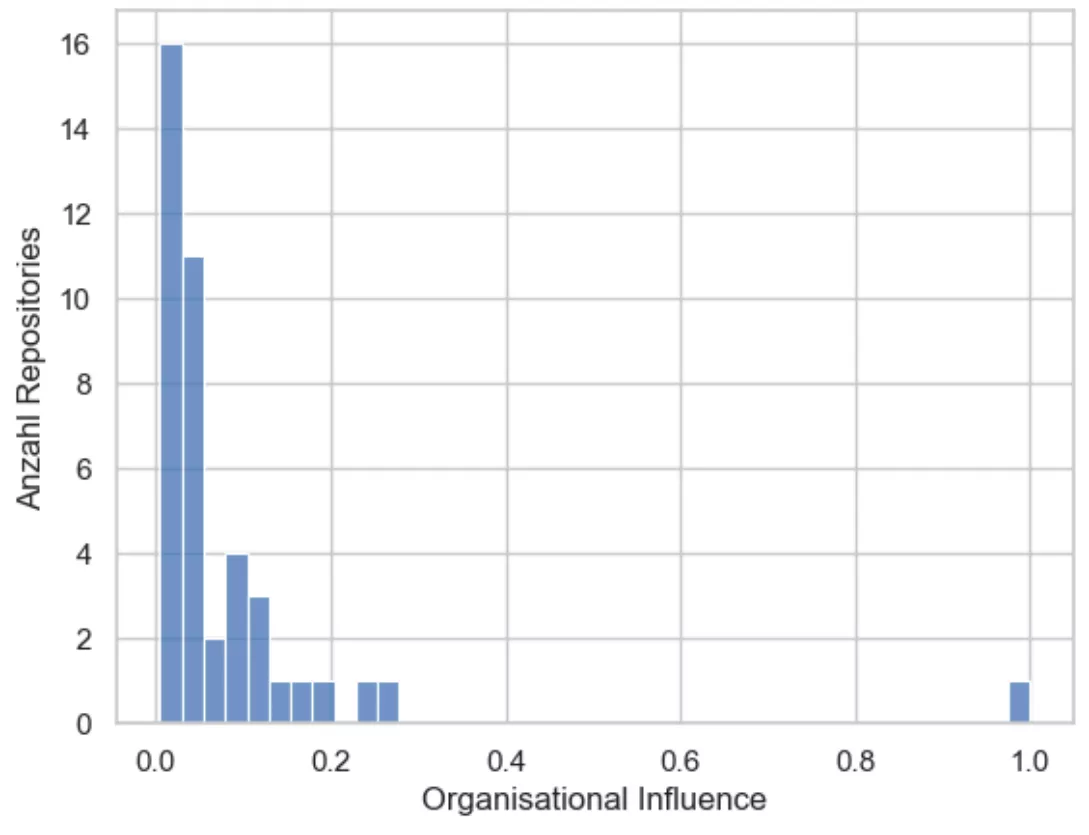
The evaluation of the metric "Organisational Influence" within the sample shows that for 30% of the repositories no organisational structures in relation to the company of the participants can be shown. Only one repository was identified in the sample whose development was carried out entirely within one organisation (Microsoft).
The organisational influence in relation to individual companies shows that Microsoft, for example, represents an average of 2.5% of the community within the repositories from the sample. Across all five of the big tech companies (Microsoft, Google, Meta, Amazon, Apple), the cumulative share is 5.5%. It can thus be concluded that, in terms of active participation through commits, these big tech companies account for an average of about 5 to 6 percent of the open source community of a repository on GitHub.
Conclusion
In summary, Matthias' work shows the following main points:
- Within the studied sample, a generally rather low average bus factor was observed. This indicates that individual key persons play a significant role in project development and contribute significantly to its progress. However, due to the low bus factor, risks can arise regarding continuous maintenance and development if personnel changes occur.
- In terms of company distribution, we could show that big tech companies make a significant contribution to the community in terms of active participation in the form of commits within repositories. However, it is important to note that these results do not allow for representative conclusions due to the limited size of the sample.
- We can conclude that the metrics of the CHAOSS community provide a solid basis for further analysing open source software. However, the major limitation of the bachelor thesis was to gather the necessary data within the limited time frame. Some interesting metrics therefore had to be excluded or considered for further work.


