Förderjahr 2018 / Stipendien Call #13 / ProjektID: 3793 / Projekt: Data Management Strategies for Near Real-Time Edge Analytics
The increasing amount of data and their high dimensionality in modern IoT applications make analysis of the entire datasets difficult. Thus, we are forced to consider other data representations to reveal new features supporting needed data analysis.
Among the various time series representations in the literature, SAX (Symbolic Aggregate approXimation) gained significant attention from both industry and academia. The original formulation of SAX is proposed in [1], and it has been used and extended to solve different problems in various areas such as telemedicine, finding patterns in robotics, motion capture data, and biology. One might argue that symbolic representation is mostly suitable in off-line fashion, including data mining tasks (e.g., classification, clustering) in certain areas that do not include time-criticality. We argue that the symbolic representation such as SAX can potentially assist also in near-real time challenges of future data-intensive IoT and edge-deployed applications.
Why SAX?
The SAX algorithm transforms time series into a string with a specific length using appropriate alphabet size. One of the important advantages of the SAX representation is dimensionality reduction. The goal is to make a reduced model by approximating original data, so the pattern of the data can stay the same while dimensionality can be significantly reduced. With SAX implementation in the edge environment, we could significantly reduce network bandwidth usage, save edge storage, and potentially reveal useful analytics features from new data representation. So let’s demonstrate how a time series of length 288 data points is converted into SAX word of cardinality 24.
Experimental scenario – how does the SAX conversion look like?
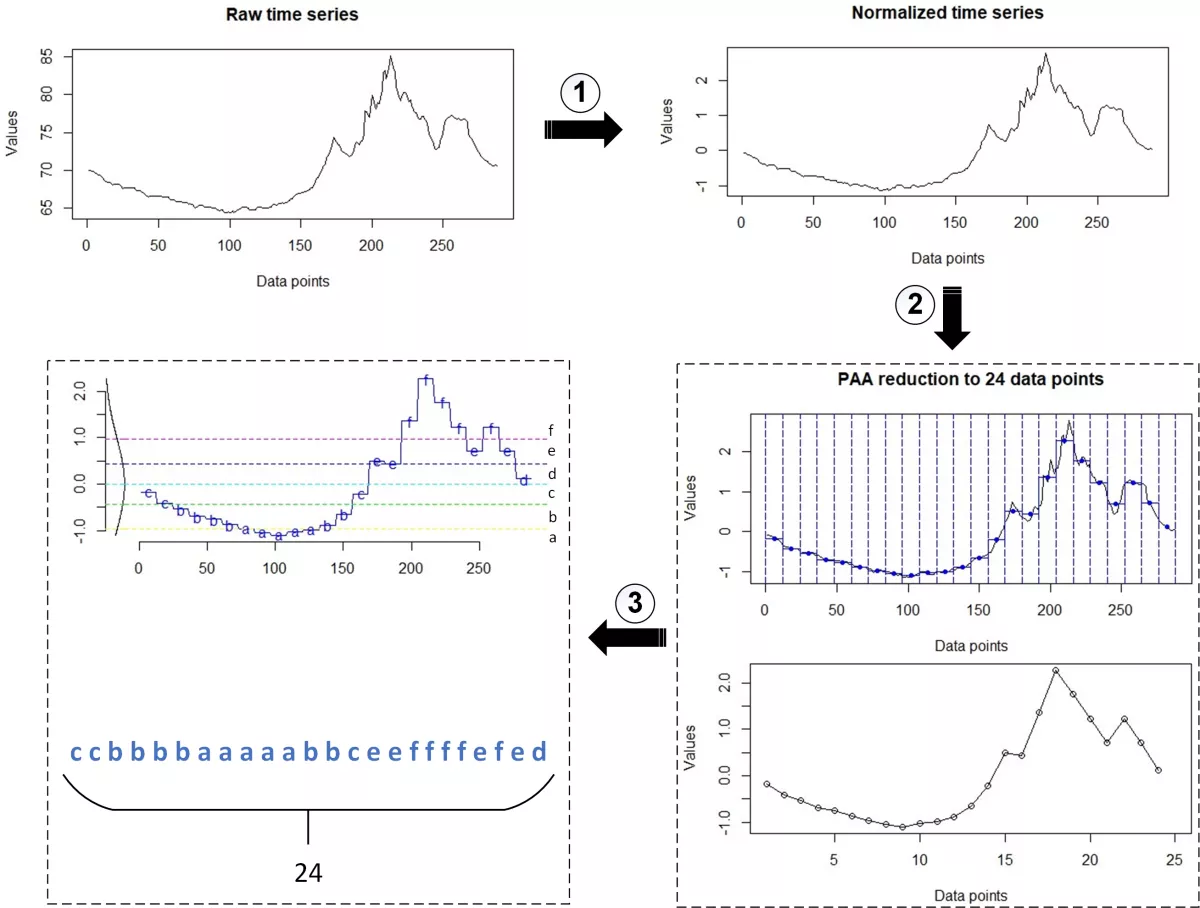
Figure 1 represents a conversion from the raw time series to SAX representation. In this scenario, we utilized traces representing 24h of heat indexes[F] collected from smart homes and obtained by the Umass Trace Repository (http://traces.cs.umass.edu). The demonstrated steps are the following:
-
Normalizing raw data. Different sensor-based time series occur at different scales measuring a variety of metrics. It is often necessary to put these series on common scale, before performing further data analysis. Normalizing data enables comparing features between different series, avoids issues with outliers and represents an important part in machine learning. In this context, we can use the transformation known as standardization, z-transformation or z-score normalization, where data are rescaled to mean of 0 and standard deviation of 1.
-
PAA (Piecewise Aggregate Approximation) reduction. PAA divides time series into a specified number of segments in which data for each segment can be represented by one specific value, i.e., the average of its data points. Thus, making an approximate data representation (as shown in the lower graph). In this context, a sequence of length 288 is reduced to dimensionality of 24.
- SAX conversion. The final step takes PAA sequence and specific alphabet size (we selected an alphabet size of 6), to produce a string of 24 letters. The used libraries and code written in R programming language can be found at the end of this blog post.
Therefore, the major idea is to make an approximation of the input data, keeping the essential features of interest for effective data analytics. Although preliminary results seem promising, there are still open questions that should be investigated:
- How can the symbolic representations be utilized in real-world scenarios, e.g., in the reduction of the storage space required?
- Since predictive analytics is all about finding patterns, how can dealing with alphabetical symbols support decision-making processes?
- How the selection of both the window length in PAA method as well as the alphabet size in SAX conversion impact later data processing?
REFERENCES
[1] Lin, Jessica, et al. "Experiencing SAX: a novel symbolic representation of time series." Data Mining and knowledge discovery 15.2 (2007): 107-144.
CODE (R language)
library(tseries)
library(jmotif)
library(TSclust)

# "homets" contains traces representing 24h of heat indexes[F]
# collected from smart homes
homets_raw <- read.csv("homets_raw.csv")
homets <- ts(homets_raw$x)

# number of window frames that divide the series (PAA parameter)
wframes <- 24
# alphabetsize (SAX parameter)
asize <- 6

# z-score normalization function
tsnorm <- function(ts) {
  (ts - mean(ts)) / sd(ts)
}

plot(homets, type="l", xlab="Data points", ylab="Values", main="Raw time series")

# normalization of series
homets_norm <- tsnorm(homets)
plot(homets_norm, type="l", xlab="Data points", ylab="Values", main="Normalized time series")

# PAA reduction of series (dimensionality reduction)
homets_paa <- paa(homets_norm, wframes)
plot(homets_paa, type="o", xlim=c(1,25), xlab="Data points", ylab="Values", main="PAA reduction to 24 data points")

# SAX conversion
homets_sax <- series_to_chars(homets_paa, asize)
# convert the values of a vector into string
paste(homets_sax, collapse="")

# convert to and plot SAX representation
SAX.plot(homets, wframes, asize)